Welcome to our new website, a direct line of communication designed to enhance business relationships by providing a clear and transparent overview of our work.
Our entire company staff are excited about taking up this new challenge, aware that new technologies are the key to continuing to offer the very highest quality and effectiveness in our services.

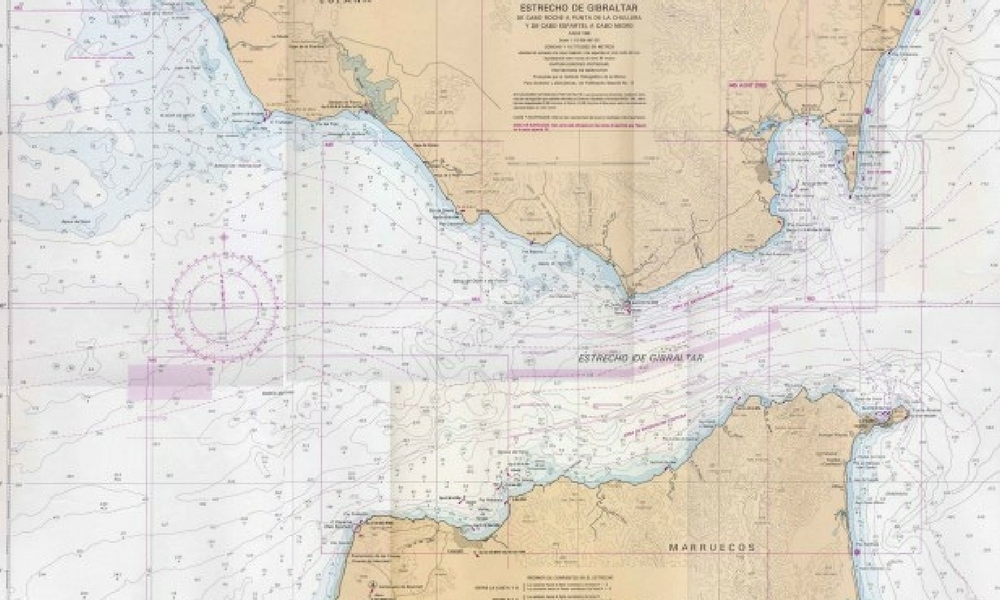
Nautical charts: safety for sea lovers
Nautical charts or navigational charts are official documents published by the Instituto Hidrográfico de la Marina (IHM) to guarantee a safe navigation. They show the depths of water and the features of the sea, including locations of natural and human made aids to navigation that sailors use to reach their destination.
Despite the existence of computerized formats, it is essential to have updated printed charts of the area on board. Computerised electronic navigational charts are considered an illustrative or auxiliary navigational aid.
This kind of sea map shows a mass of water and the adjacent coastline, with information about navigational hazards (submerged rocks, coral reefs, cable-laying on seabed), tides and currents, geographical coordinates, quality of the seabed or special precautions.
First navigational charts
The first navigational charts appeared in the XIIIth century after the creation of a new navigational cartography. They were the so-called Portolan charts, and included information about maritime routes, details of the coastline, navigable areas, tides and winds.
They were intended to become a useful and practical document so they only included the toponymy, the routes and the orientation. Venice, Geneva and Palma were the first production centres of these maps for centuries.
Today, vessels use two types of charts: Mercator and gnomonic charts, which are based on the representation of the earth (convex) on a flat surface. The Mercator charts are used for loxodromic navigation (rhumb lines) and are based on cylindrical projection, so the meridians are parallel. The gnomonic charts represent land surfaces on planes tangential to a point.
Specific features
Nautical charts show the scale of latitudes on the side margins and the longitudes on top and bottom ends. The distance scale is very different to that shown on land maps, as it takes as the benchmark the nautical mile (which is equivalent to 1.852 metres).
In order to measure a mile on a navigation chart, we have to put the spring divider on a minute of the latitude scale. It would be a mistake to take as the benchmark the longitude minutes, as the diameter of the parallels diminishes as they get close to the poles.
Auxiliary and downloadable navigational charts
The Instituto Hidrográfico de la Marina offers us the possibility to access all the Spanish navigational charts in a public and downloadable format.
Format map web services (WMS)
Format download data web services (WFS)
Web with official and updated charts
Display (http://ideihm.covam.es/visor.html) through the Android systems and the free program ORUXMAPS.
However, from our bunkering agency in Ceuta, we remind you that computerized electronic navigational charts and the GPS do not substitute the paper format, the loyal companion that never fails. Do not forget to keep the charts updated and ready to be used at any time.